Kp-index

Chart

Chart with 0 data points.
The chart has 1 Y axis displaying values. Data ranges from 0 to 9.
End of interactive chart.
Kp-index forecast
Min. Max.
WednesdayKp2+Kp5
ThursdayKp2Kp4
FridayKp2Kp4-

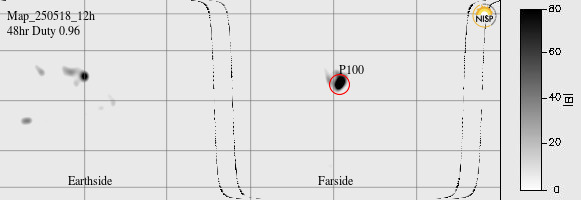
Real Time Solar Wind

With the current speed, it will take the solar wind 60 minutes to propagate from DSCOVR to Earth.
Solar wind
Speed: km/sec
Chart
Chart with 0 data points.
The chart has 1 X axis displaying Time. Data ranges from 1970-01-01 00:00:00 to 1970-01-01 00:00:00.
The chart has 1 Y axis displaying km/sec. Data ranges from 0 to 0.
©NOAA SWPC - SpaceWeatherLive.com
End of interactive chart.
Density: p/cm3
Chart
Chart with 0 data points.
The chart has 1 X axis displaying Time. Data ranges from 1970-01-01 00:00:00 to 1970-01-01 00:00:00.
The chart has 1 Y axis displaying p/cm3. Data ranges from 0 to 0.
©NOAA SWPC - SpaceWeatherLive.com
End of interactive chart.
Interplanetary Magnetic Field
Bt: nT
Chart
Chart with 0 data points.
The chart has 1 X axis displaying Time. Data ranges from 1970-01-01 00:00:00 to 1970-01-01 00:00:00.
The chart has 1 Y axis displaying nT. Data ranges from 0 to 0.
©NOAA SWPC - SpaceWeatherLive.com
End of interactive chart.
Bz: nT
Chart
Line chart with 0 data points.
The chart has 1 X axis displaying Time. Data ranges from 1970-01-01 00:00:00 to 1970-01-01 00:00:00.
The chart has 1 Y axis displaying nT. Data ranges from 0 to 0.
©NOAA SWPC - SpaceWeatherLive.com
End of interactive chart.

Auroral oval

Aurora map
Hemispheric Power
Chart
Bar chart with 2 data series.
The chart has 1 X axis displaying Time. Data ranges from 1970-01-01 00:00:00 to 1970-01-01 00:00:00.
The chart has 1 Y axis displaying Gigawatt. Data ranges from 0 to 0.
©NOAA SWPC - SpaceWeatherLive.com
End of interactive chart.
Northern hemisphere
Southern hemisphere

Disturbance Storm Time index

Chart

Line chart with 2 lines.
The chart has 1 X axis displaying Time. Data ranges from 1970-01-01 00:00:00 to 1970-01-01 00:00:00.
The chart has 1 Y axis displaying nT. Data ranges from 0 to 0.
WDC Kyoto Observatory
End of interactive chart.
More data

Moon phase


Waxing Crescent

Sunspot regions

Solar Dynamics Observatory HMI Continuum
Sunspot regions
RegionNumber of
sunspots
Class
Magn.
Class
Spot
40921HSX
40942AXX
40961HSX
409916DKC
410014EKI
41016CRO
41022BXO
41034BXO
Today's Sun
Sunspot number 116 3
New regions2 1
10.7cm Solar Radio Flux144 7
Carrington Rotation2298

Solar flares

SDO AIA 131
Solar activity past two hours
Chart
Empty chart
©NOAA SWPC - SpaceWeatherLive.com
End of interactive chart.
Current value
2h max
24h max
More data Help
Flare probability
C-class solar flare 99%
M-class solar flare 50%
X-class solar flare 10%

Coronal holes

SDO AIA 193

Solar protons

Chart

Line chart with 0 data points.
The chart has 1 X axis displaying Time. Data ranges from 1970-01-01 00:00:00 to 1970-01-01 00:00:00.
The chart has 1 Y axis displaying Particles/cm-2s-1sr-1. Data ranges from -2 to 6.
©NOAA SWPC - SpaceWeatherLive.com
End of interactive chart.
Info Help

Far side

GONG Calibrated Farside Map
© NSO/GONG

Latest news

Support SpaceWeatherLive.com!

A lot of people come to SpaceWeatherLive to follow the Sun's activity or if there is aurora to be seen, but with more traffic comes higher server costs. Consider a donation if you enjoy SpaceWeatherLive so we can keep the website online!

Donate SpaceWeatherLive Pro
Support SpaceWeatherLive with our merchandise
Check out our merchandise

Latest alerts

Get instant alerts!

Space weather facts

Last X-flare2025/05/25X1.1
Last M-flare2025/05/26M1.4
Last geomagnetic storm2025/05/17Kp6+ (G2)
Spotless days
Last spotless day2022/06/08
Monthly mean Sunspot Number
April 2025140.6 +6.4
May 202578.1 -62.5
Last 30 days78.1 -48

This day in history*

Solar flares
12003X5.17
22011M1.67
31998M1.51
42000M1.24
52011M1.19
DstG
12017-125G3
21967-111G3
31970-87G3
42011-80G2
51994-68G3
*since 1994

Social networks