Indice Kp
Previsione dell'indice Kp
| Min. | Max. | |
|---|---|---|
| domenica | Kp1 | Kp3 |
| lunedì | Kp1 | Kp3- |
| martedì | Kp1 | Kp3- |
Vento Solare in Tempo Reale
Con la velocità corrente, ci vorranno 60 minuti al vento solare per propagarsi da DSCOVR alla Terra.
Vento solare
Velocità: km/s
Densità: p/cm3
Campo Magnetico Interplanetario
Bt: nT
Bz: nT
Info Altri dati
Indice del Tempo di Perturbazione
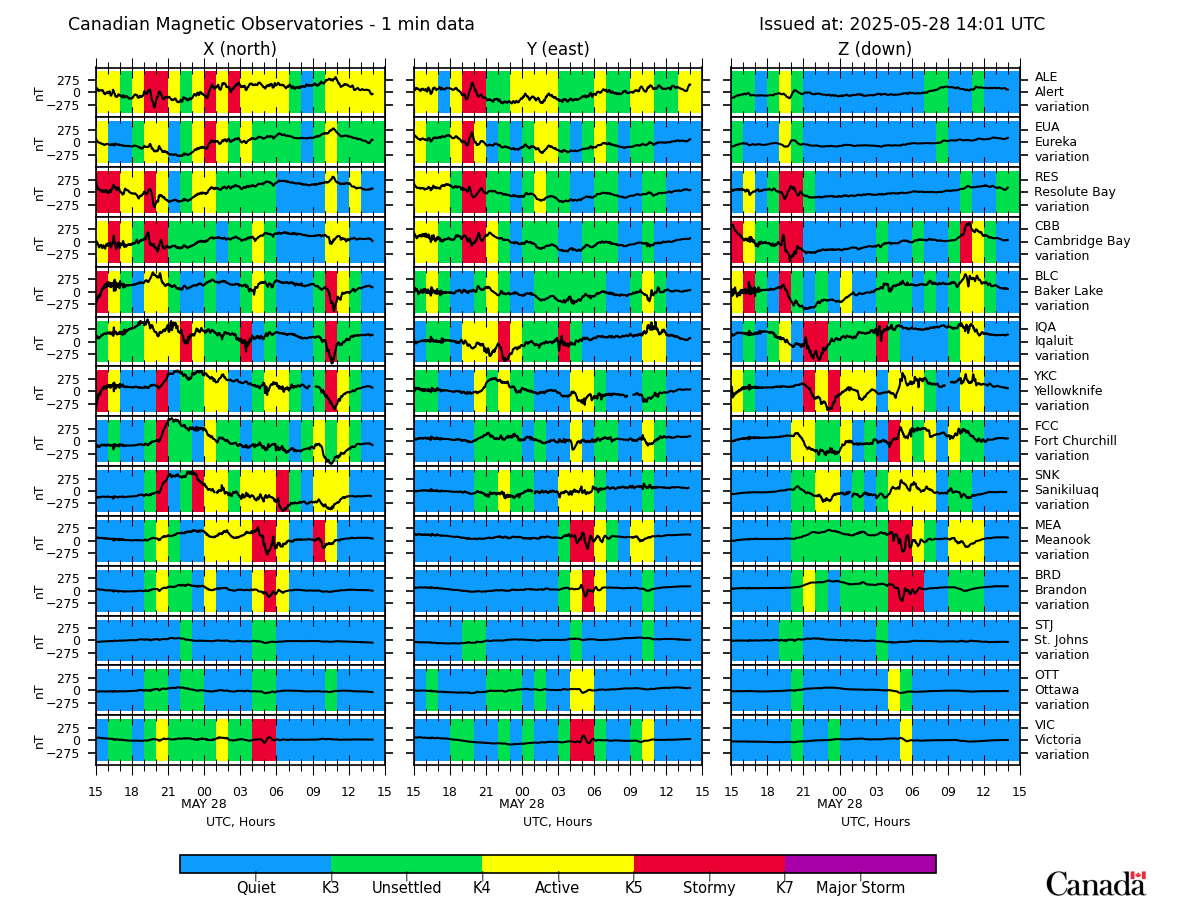
Magnetometri
Fase lunare
Luna Calante
Ultime notizie

mercoledì, 14 maggio PM
Another X-flare! Potent sunspot region 4087!
martedì, 13 maggio PM
X1.1 solar flare from sunspot region 4086

martedì, 15 aprile PM
CME arrival, G3 storm watch
Ultimi messaggi dal forum
AR 14098 27Unspecified geomagnetic activity 2513Incoming & Unnumbered Active Regions 1914Strong far side CME 409Filaments and prominences 178
Altri argomentiSupporta SpaceWeatherLive.com!
Molte persone vengono su SpaceWeatherLive per seguire l'attività del Sole o sapere se ci sia la possibilità di vedere l'aurora, ma a maggior traffico corrispondono costi maggiori. Considerate una donazione se vi piace SpaceWeatherLive così che possiamo mantenere online il sito web!

Notizie sul meteo spaziale
| Ultimo brillamento X | 2025/05/14 | X2.7 |
| Ultimo brillamento M | 2025/05/24 | M2.2 |
| Ultima tempesta geomagnetica | 2025/05/17 | Kp6+ (G2) |
| Giorni senza macchie | |
|---|---|
| Ultimo giorno senza macchie | 2022/06/08 |
| Media mensile Numero di Macchie Solari | |
|---|---|
| aprile 2025 | 140.6 +6.4 |
| maggio 2025 | 73.1 -67.5 |
| Ultimi 30 giorni | 81.8 -37.6 |